

In this fun glucose experiment, we’re going to test a variety of foods and drinks to determine which contain the most glucose. People with diabetes may find this information useful, so they know which foods are best to eat when they have symptoms of low blood sugar. Here are the questions we want to answer today: Which foods contain the most glucose? Which foods are best for a diabetic to eat or drink when their blood sugar is too low?
When diabetics have symptoms of low blood sugar, they’re supposed to eat something high in glucose immediately. Let’s start experimenting to figure out the right answer.
Materials
- 8 different foods
- A scale (for example, a triple beam balance)
- Cup
- Water
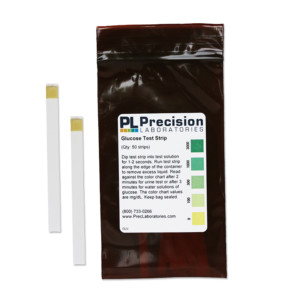
- Glucose Test Strips (10)
- Stopwatch
- Glucose tablet
Procedure
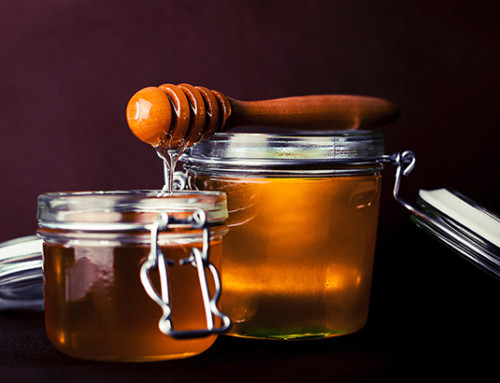
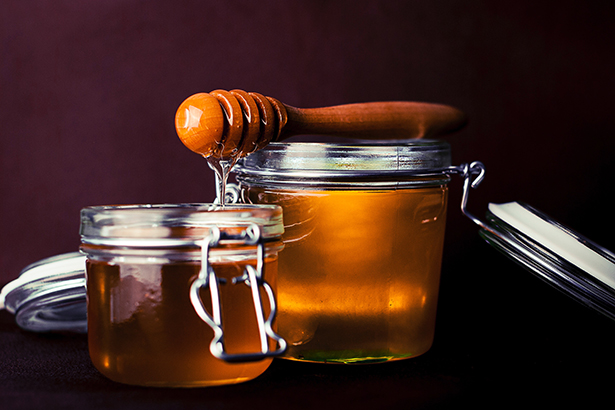
- Choose 8 different foods and drinks to test for glucose. For example, you might choose orange juice, lemon juice, an apple, honey, a tomato, soda, ketchup, and sugar water. These are just examples – choose whatever items you already have around the house!
- Using a scale or triple beam balance, measure 5 grams of each food or drink you have selected.
- Make a hypothesis about which foods you think will be highest in glucose and which will contain the least amount of glucose, and record in your laboratory notebook.
- To create a negative control, fill your cup with tap water, and dip a glucose test strip into the water. Make sure to completely immerse the test pad into the water for 1-2 seconds. Shake off any excess liquid, and wait 3 minutes before comparing to the color chart. There should be no color change.
- To create a positive control, make a glucose solution. Make sure your cup of tap water has a mass of 5 grams. Add a glucose tablet to the cup of water and let it dissolve. Now, dip a glucose test strip into the solution. Again, make sure to completely immerse the test pad into the water for 1-2 seconds. Shake off any excess liquid, and wait 3 minutes before comparing to the color chart. This time, you should definitely see a color change.
- In your positive control, what reading did you get on the color chart? Did the color change to the darkest color before the 3 minutes was up? If so, it means there was more than 3000 mg/dL in the solution.
- Now it’s time to test your food samples. You will need a test strip for each food and drink sample. To test your drink samples, dip the strip into the liquid, immersing completely for 1-2 seconds. Wait 3 minutes and compare to the color chart. Record all of your observations in your laboratory notebook.
- To test your food samples, press the test strip against a moist edge of the food for 1-2 seconds to ensure the test pad is completely moistened. Wait 3 minutes, then compare against the color chart. Record all of your observations in your laboratory notebook.
- Note: If your test pad result is a color that falls in between two colors on the color chart, simply take the average of those two values.
Now it’s time to analyze your data. Which foods and drinks had the most glucose? Which had the least? Was your hypothesis correct? Why was it important to measure out the same amount of each food to be tested?
Leave A Comment